Healthcare Industry Profile (NAICS: 62)
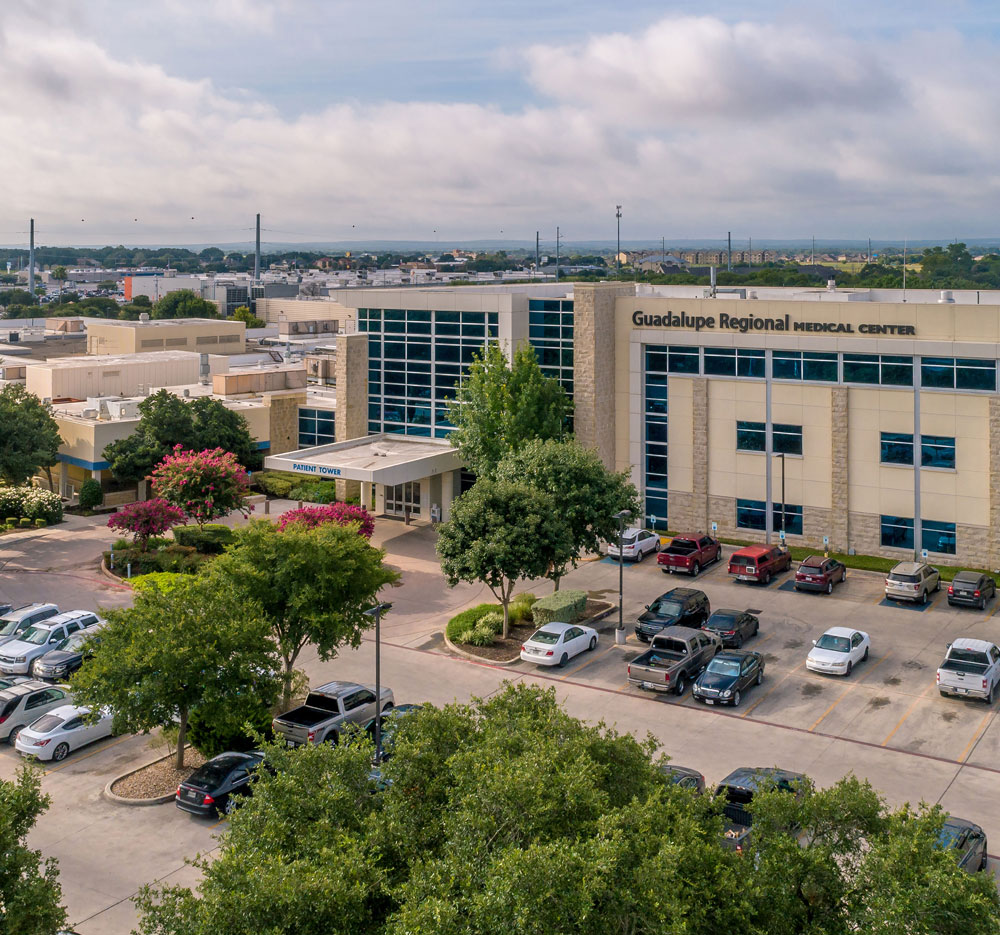
It’s not all about manufacturing in Seguin, we are also home to thriving healthcare sector as well. Seguin is hope to the Guadalupe Regional Medical Center (GRMC), where exceptional healthcare is always right around the corner. By providing state-of-the-art technology and the most individualized care possible, GRMC has been the community’s preferred choice for healthcare for more than 50 years. As the only city-county hospital in Texas, Guadalupe Regional is a non-profit community hospital which does not depend on tax support. GRMC’s team of highly-qualified physicians and nurses deliver world-class treatment to each and every patient with the warmth and compassion they deserve. The culture of caring is so special at GRMC; GRMC has consistently been recognized as “One of the Best Places to Work.” In addition we’ve also been consistently recognized as being one of the safest hospitals in the United States. GRMC is also nationally recognized a Five-Star recipient in total knee replacement, five years in a row, hip fracture treatment, eleven years in a row, and appendectomy, three years in a row by Health Grades.
Download a Healthcare Industry Profile (NAICS: 62) Report
.jpg)
Healthcare Industry Overview
| Total Employment | Average Annual Wages | Location Quotient (LQ) | Average Annual % Change in Employment (10-Year History) | Average Annual Growth Rate | |
|---|---|---|---|---|---|
| Seguin Region (ZCTA: 78155 & 78123) | 2,513 | $56,390 | 0.67 | +.05% | +3.0% |
| Guadalupe County | 4,258 | $54,834 | 0.54 | +1.4% | +3.1% |
| San Antonio - New Braunfels MSA | 178,432 | $60,799 | 1.01 | +2.1% | +1.9% |
Source: JobsEQ® Data as of 2024Q1
Healthcare Industry Sector Snapshot
Snapshot for the Seguin Region (78155 & 78123)
| 6-Digit NAICS Industry Sector | Estimated Employment | Average Annual Wages | Location Quotient (LQ) | Average Annual Growth Rate |
|---|---|---|---|---|
| General Medical and Surgical Hospitals | 570 | $70,786 | 0.59 | 2.7% |
| Nursing Care Facilities | 394 | $40,809 | 1.71 | 2.3% |
| Offices of Physicians | 359 | $80,149 | 0.79 | 3.1% |
| Child Day Care Services | 143 | $28,647 | 0.77 | 2.3% |
| Offices of Dentists | 134 | $63,717 | 0.83 | 3.0% |
| Home Health Care Services | 105 | $43,148 | 0.41 | 3.6% |
| Residential Intellectual and Developmental Disability Facilities | 125 | $41,599 | 1.71 | 2.7% |
| Home Health Care Services | 116 | $37,718 | 0.42 | 3.9% |
| Other Individual and Family Services | 100 | $54,023 | 1.01 | 4.4% |
| Total - Healthcare | 2,513 | $56,390 | 0.67 | 2.4% |
Source: JobsEQ® Data as of 2024Q1


